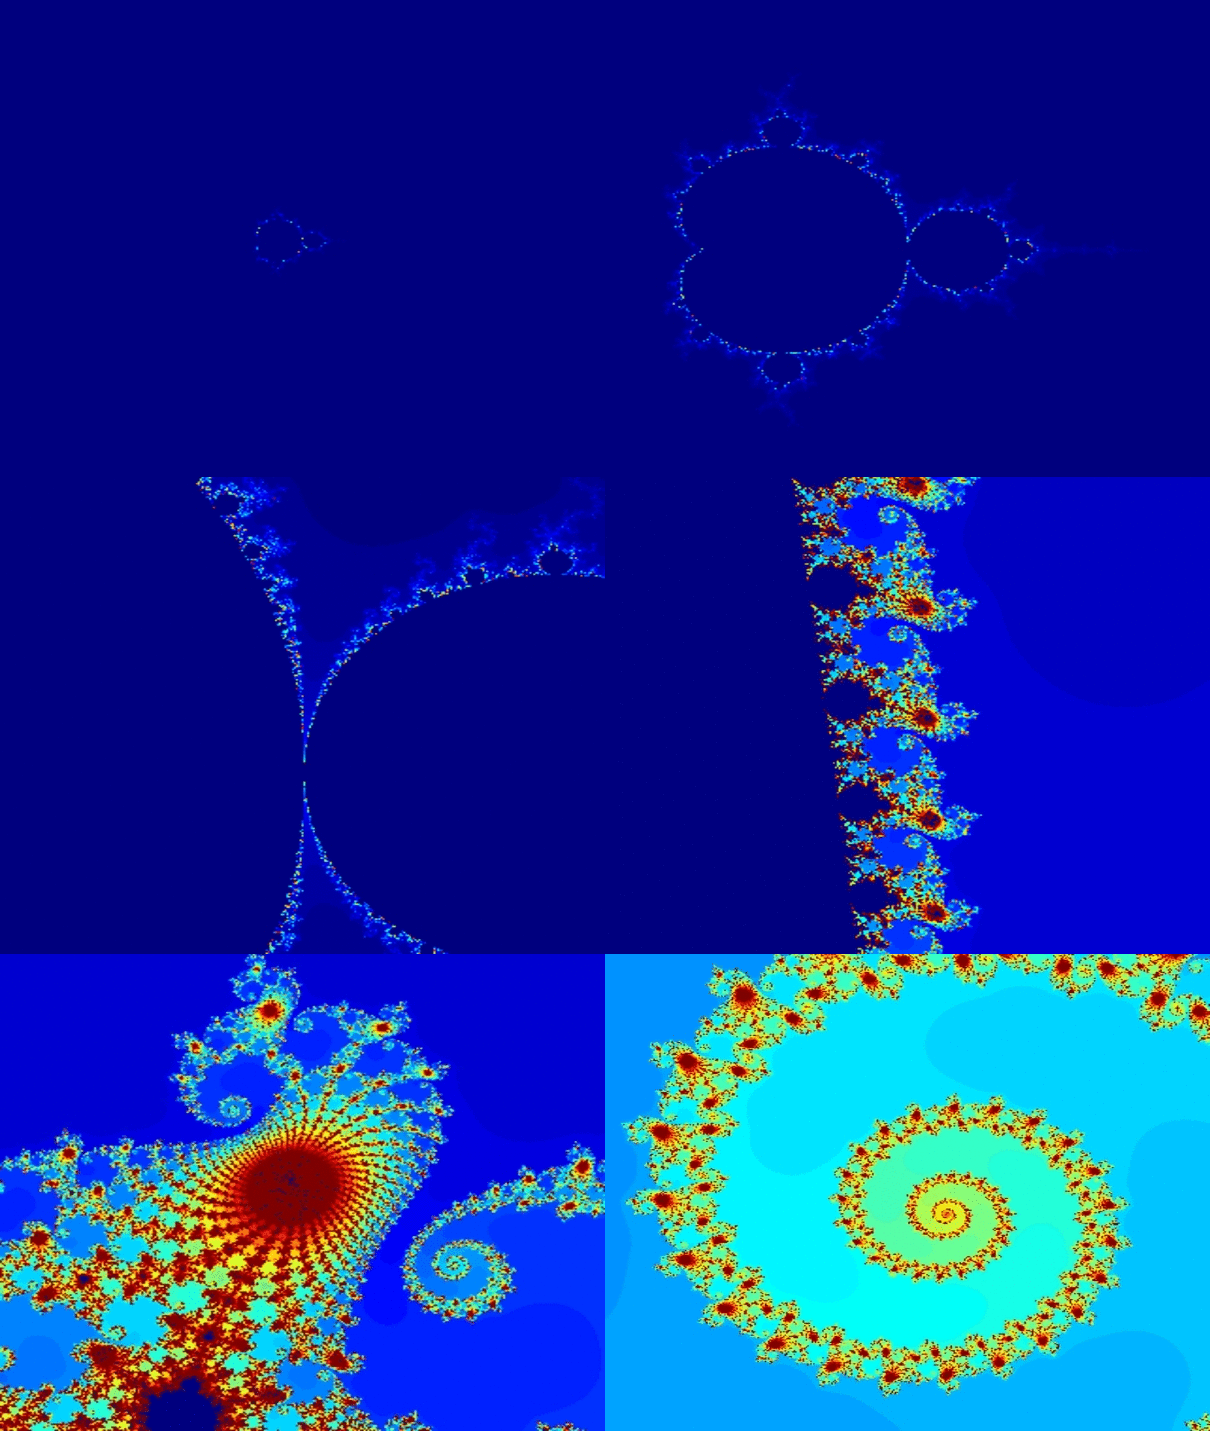
This howto will show you how to easily make images of fractals with GNU Octave, a free and open source numerical software package.
Prerequisites
First you will need to install Octave, if you do not already have it installed. There should be a version for your operating system available there.
Iin Ubuntu this is as simple as typing
sudo apt-get install octavein a terminal window.
If you want or need some background on the Mandelbrot set you can check out the Wikipedia page here.
What generates the fractal?
We will generate the fractal from the Mandlebrot set by iterating the map
\[ f(z)=z^2-\tau, \]
for a range of complex numbers \(\tau\), taking \(z=-\tau\) as the initial value. The colouring of a particular value of \(\tau\) is determined by the rate at which the iteration diverges, i.e., such that the size of \(z\) gets larger and larger without bound, where the size of a complex number \(z=x+iy\)) is measured by \(|x|^2+|y|^2\).
For those unfamiliar with complex numbers, for our purposes here it may suffice to think of a complex number \(z=x+iy\) as a point \((x,y)\) in the plane, so that \(x\) and \(y\) are the coordinates of the complex number in the plane and the size of a complex number is its distance from the origin.
How the script works
We generate the fractal by choosing values of \(tau\) on an \(n\times n\) grid (I chose \(\texttt{n}=600\)) and then computing how many iterations of \(f\) it takes for \(z\) to become larger than some large number, the tolerance \(\texttt{tol}\) (I chose \(\texttt{tol}=10^6\)).
So that this computation doesn't go on for ever, we stop if \(z\) hasn't gotten larger than \(\texttt{tol}\) after some maximum number of iterations (I chose \(\texttt{its}=80\)). If it never passes this value it is taken to be a "fixed point" and is coloured at one end of the colour scale. If it passes the tolerance \(\texttt{tol}\) for some number of iterations \(\texttt{m}\) less than \(\texttt{its}\) then we colour the point based on the value of \(\texttt{m}\).
The faster the divergence the smaller \(\texttt{m}\) is, and the more red (in our chosen colour space) the point will be.
Overall, then, for a complex number \(\tau=x+iy\) (point \((x,y)\) in the plane), where we restrict attention to that part of the plane such that \(x\) is in the range \([-1,2.25]\) and \(y\) is in the range \([-1.5,1.5]\), we compute the number of iterations \(\texttt{m}\) it takes for \(z=z^2-\tau\) (starting with \(z=-\tau\)) to grow larger in size, i.e., larger in distance from the origin, than the tolerance \(\texttt{tol}\), which determines the colour of the point.
Executing the script to make the fractal image
Executing the script to make the fractal image is easy. To execute the script below, copy the code below into a text editor and save the file as "mandelbrot.m". Then, open a command line terminal and, when you are in the directory where you saved the file, type
octave mandelbrot.mand wait for the computation to complete. You may want to reduce the number \(\texttt{n}\) of points the first time you run it to be sure that everything is working.
f=@(z,tau)(z^2-tau);
n=600;
its=80;
tol=1.0e6;
colscale=128;
colormap(gray(colscale));

xmin=-1;
xmax=2.25;
ymin=-1.5;
ymax=-ymin;
deltax=xmax-xmin;
deltay=ymax-ymin;

X=zeros(n,n);

for k=1:n+1
    for l=1:n+1
    	x=xmin+deltax*(k-1)/n;
    	y=ymin+deltay*(l-1)/n;
	tau=x+j*y;
	z=f(0,tau);
	m=0;
	while norm(z)<tol && m<its
	    z=f(z,tau);
	    m=m+1;
	end
	if norm(z)>tol || isinf(z) || isnan(z)
	   X(l,k)=round(colscale*m/its);
	end
end
end

image(X)
axis off
colormap('default');

print -dpdf "mandelbrot.pdf"
Once the script completes, which will take a while depending on your machinery, you should find a pdf copy of the image you computed called "mandelbrot.pdf". It should look like this:

If you would prefer a jpg output, you can change the last line of the script to
\(\texttt{print -djpg "mandelbrot.jpg"}\)
Now you can explore the Mandelbrot set by changing the \(x\) and \(y\) ranges and creating new images. Remeber to change the pdf filename so you don't copy over your old images!
As an illustration of the manner in which you can explore by changing the range of the points you compute, here is an animated gif of images generated by modifying this script that "zooms in" to the Mandelbrot set.

Keep in mind that the more you zoom in the slower, generally, the convergence, so you need to make adjustments so that your computations do not take too long.
